Proponents of no-growth measures like Measure LV, or the Land Use Voter Empowerment (L.U.V.E.) as its backers have dubbed it, in Santa Monica often seek to expand political support by framing their measure as a necessary response to trends of “overdevelopment.”
In short, the initiative would require a vote of the people for nearly all new construction taller than 32 feet (or two stories). It would also require a vote on major repairs on existing buildings above the threshold height and it fails to exempt public safety buildings, hospitals, schools, and other vital structures.
This political framing — that a certain vote is necessary to protect people from some perceived evil — is not unique to growth battles in Santa Monica. Donald Trump spoke half truths on the final night of the Republican National Convention, saying that urban crime was on the rise and only he, as the law and order candidate, could save us.
As with crime trends, it’s possible to fact-check development trends.
The city has seen a slower pace of commercial development than the proponents of the failed 2008 slow-growth initiative, Measure T, could have dreamed of. Measure T, or the Residents’ Initiative to Fight Traffic (RIFT) as its proponents called it, would have capped most commercial development at 75,000 square feet a year. Despite Measure T’s sound defeat, official records show that only about an average of 48,000 square feet of net new commercial space has been built in Santa Monica each year since 2003. That’s more than 25,000 square feet less a year than would have been allowed had Measure T passed.
So, it’s clear that Santa Monica has remained a slow-growth city when it comes to commercial development. But what about on the residential side?
We’ve shown that 1945 to 1979 were the boom years for housing in Santa Monica, when the city added so much housing at such a robust rate. In fact, an average of about 850 units per year from that period still stand today.
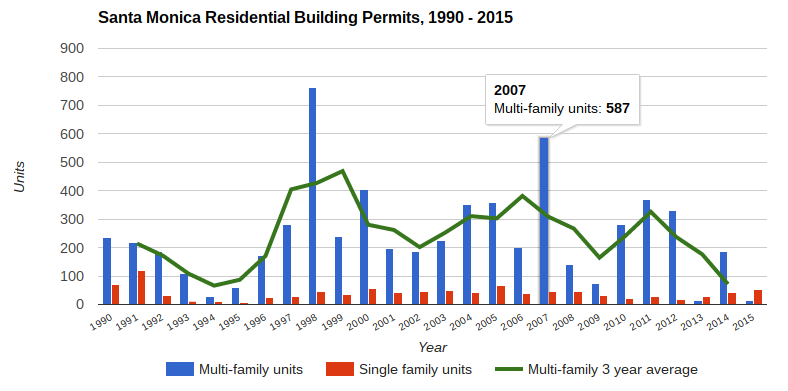
But, on a more granular basis over the past 35 years, has Santa Monica approved more or less housing in the past few years
Using building permit data from the past 35 years, we see that the pace at which the city issues building permits for new multi-family homes is the slowest it has been since 1994, the year of the Northridge quake.
When it comes to the actual pace of development, the slow-growth factions in Santa Monica have largely already won. Measure LV would go even further to stop virtually all new growth over 32 feet. And, in order to that, it seems that they, like Trump, want to exploit differences between perception and reality.
Data Sources: Data Source 1990-2010 unit count: Construction Industry Research Board via RAND California Statistics; 2011-2015 unit count Data Source 2011-2015: US Census Bureau Building Permits Survey