The following post first appeared at Streetsblog Los Angeles.
“Last month we hit a major milestone as we averaged more than one million boardings each weekday on our system,” Metro CEO Stephanie Wiggins acclaimed at last month’s Metro board meeting. “Now this milestone is a tribute to all of our efforts over the past three years to recover ridership by making our system cleaner, safer, more comfortable, reliable, and easier for all our customers.”
Surpassing a million daily boardings is a big accomplishment. Kudos to CEO Wiggins and her team for two years of sustained steady ridership growth.

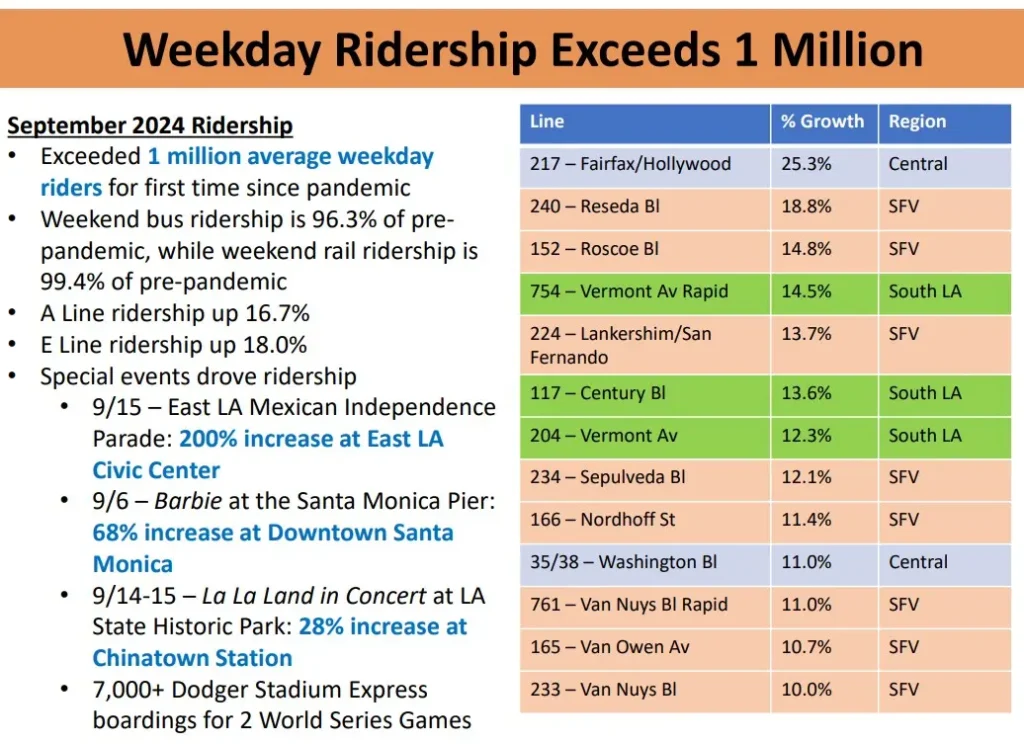
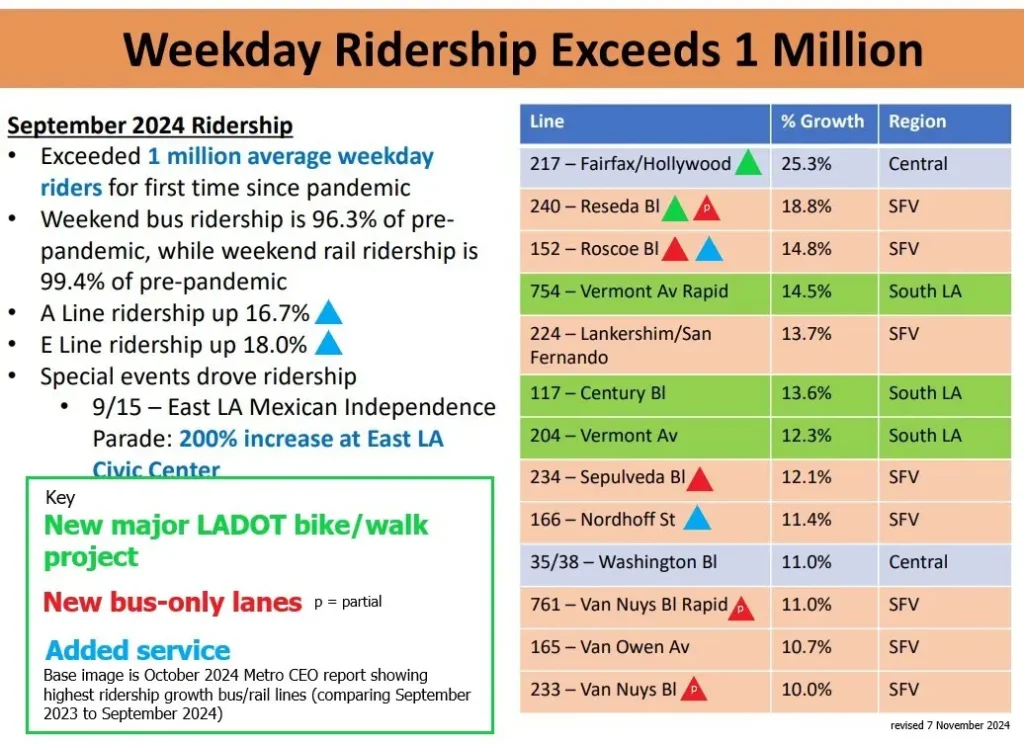
CEO Wiggins characterized the recent ridership growth as broad-based, citing rail, bus, weekday, and weekend (including big weekend events) gains. Her slide (above) listed the top bus and rail lines that account for the highest ridership growth (year-over-year comparing September 2024 to September 2023).
What’s behind Metro’s excellent sustained steady ridership growth? Streetsblog reviewed CEO Wiggin’s leading lines slide and identified some factors that appear to be bolstering Metro ridership growth.
First a caveat that numerous complex factors influence ridership. The September figures are a snapshot, so it is possible to overinterpret what factors play what roles in growing ridership over time. Many influences are outside Metro’s control, e.g. gas prices, economic trends, and gentrification. Others are Metro’s responsibility: frequency, reliability, fares, cleanliness, etc.
From September 2023 to September 2024, overall Metro ridership grew 7.5 percent (with bus up about 7 percent, and rail up nearly 10 percent). The CEO’s slide lists the top larger bus lines in order of percentage growth. Where the overall system saw 7.5 percent growth, these lines grew 10-25 percent. Three rail lines (E, A, and C) also posted annual growth exceeding 10 percent.
What influenced these lines’ outsized system-leading ridership increases?

Streetsblog identified three factors that corresponded with ridership growth:
- Added bus/rail service
- Bus speed improvements: bus-only lanes
- Complete streets improvements
More Transit Service Means More Riders
This one is perhaps obvious: where Metro added service, ridership increased. More frequent transit doesn’t come cheap, but here’s where added service meant higher ridership growth:
- In December 2023, Metro added light rail service (largely restoring pre-pandemic service levels) resulting in more riders on the E Line (+18%), A Line (+16.3%) and C Line (+10.7%).
- In June 2024, as part of its East San Fernando Valley transit project, Metro added service on Lines 152 – Roscoe (+14.8%) and 166 – Nordhoff (+11.4%).
Bus-Only Lanes Mean More Riders
Since September 2023, Metro (partnering with L.A. City Transportation Department – LADOT) opened three new bus-only lanes. All three bus lane streets saw outsized ridership gains:
- Metro/LADOT Roscoe Boulevard bus-only lanes opened in August 2024. Roscoe’s Line 152 bus saw year-over-year +14.8% ridership growth.
- Metro and LADOT opened the Valley’s first bus-only lanes in October 2023. The vast majority of the project is on Sepulveda Boulevard, where Line 234 saw a +12.1% rider growth.
- The 2023 Sepulveda bus lane project includes a short stretch of Ventura Boulevard morning peak-hour bus lane that serves the 234 mentioned above. That stretch of Ventura also carries and (modestly) benefits three other top ridership growth lines: Reseda Boulevard (+18.8%), and two Van Nuys Boulevard buses: Rapid 761 (+11%) and local 233 (+10%).
Compared to ongoing costs for increased service, adding bus lanes is relatively inexpensive. Metro and LADOT have added forty miles of new bus lanes in recent years, with more on the way. New automated enforcement just underway will help make these facilities even more effective.
Complete Streets Correspond to More Riders
The top two ridership growth Metro bus lines are on streets where the city of L.A. (mainly LADOT) completed ambitious bike/walk/bus projects during the past year.
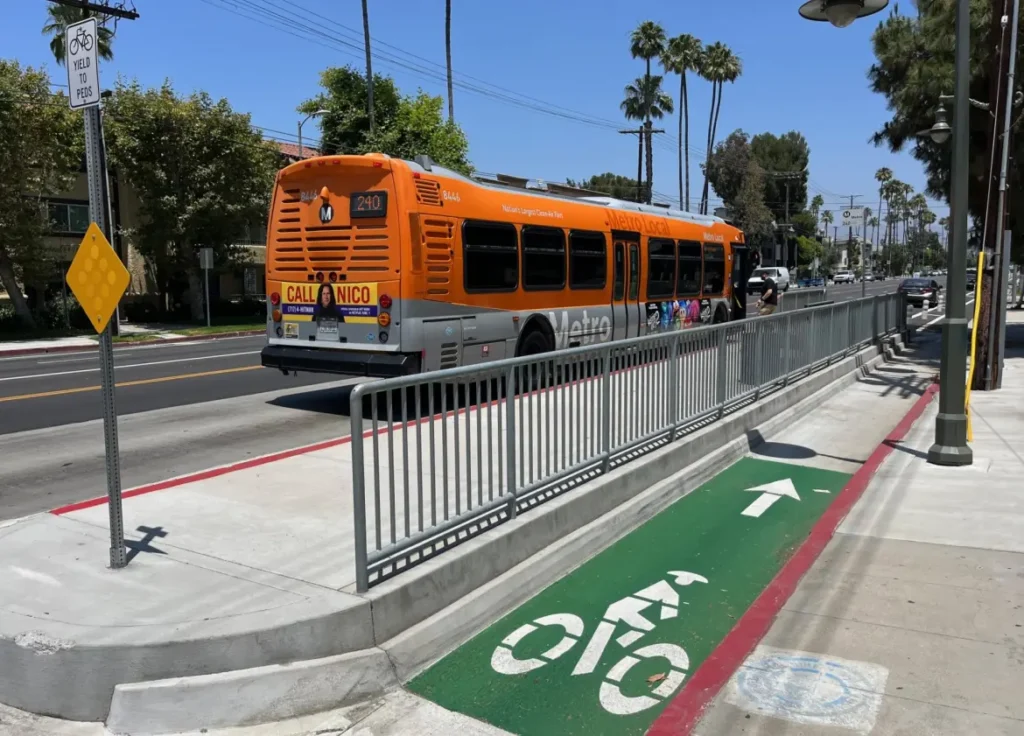
Metro’s second highest ridership gain (+18.8%) was on Line 240 on Reseda and Ventura Boulevards. In March, the city opened its four-mile Reseda Boulevard Complete Streets Project, which includes extensive bike, walk, and bus upgrades.

The Reseda project retooled numerous bus stops, adding islands that facilitate faster boarding and faster merging back into traffic for the bus (while protecting bicyclists and separating them from traffic, including bus traffic).
The Reseda Complete Streets project is 4.1 miles of the ~17-mile Line 240 route. The project likely contributed to ridership growth, but it is not clear to what extent.
The picture is more complicated for Metro’s highest ridership gain (+25.3%) Line 217 on La Cienega Avenue, Hollywood Boulevard, and Los Feliz Boulevard.
As part of its June 2024 twice-yearly service changes, Metro retooled the route of Line 217, almost doubling its length by adding about seven miles through Los Feliz and Glendale to Eagle Rock (overlapping with Line 180). This represents partial restoration of some Glendale-area bus service that was consolidated or eliminated as part of earlier NextGen changes.
That change means that the 25 percent year-on-year growth on Line 217 is not an apples-to-apples comparison. The new 217 route drew some riders away from Line 180, which saw a small ridership decrease. Looking at combined ridership figures for both Lines 217 and 180, there was 5.1 percent year-on-year growth. Five percent growth is good, but shows that the 25 percent increase represents more ridership shifting between lines and less actual growth.
The 217 (and 180) routes correspond to LADOT’s ambitious Hollywood Boulevard quick-build safety project (a two-mile road diet for new parking-protected bike lanes). The Hollywood project may have helped grow Metro ridership, though it involved bike and walk improvements without significant transit-specific features. It is also just two miles on a 15.5-mile Line 217 route.
To get further into the weeds, other Metro service changes played minor roles in ridership growth. Metro continuously adjusts service, generally batching numerous small adjustments each June and December. For more details on other smaller changes that like affected the top growth lines (all fairly minor changes some positive, some negative), see SBLA spreadsheet.

All in all, Metro’s 22 months of sustained ridership growth are worthy of celebration. Recovering riders during the pandemic era has been difficult for many agencies around the United States. Metro’s hard work and strategic investments are paying off. Increased service, more bus lanes, and more complete streets projects are important for continued ridership growth.
