This post originally appeared on Santa Monica Next’s sister site, Los Angeles Streetsblog.

Since 2016, the media has been reporting that Metro ridership is declining. But how bad is the problem and what is causing it? A report out this week takes a hard look at the data. Falling Transit Ridership: California and Southern California was commissioned by the six-county Southern California Association of Governments (SCAG). The 70-page report comes from UCLA Institute for Transportation Studies authors Michael Manville, Brian D. Taylor, and Evelyn Blumenberg.
While the diagnosis is far from conclusive, and nearly no prescriptions are offered, the report attributes the Southern California region’s falling ridership to increases in car ownership, especially among folks who have historically tended to ride transit: low-income immigrants, especially Latinos.
Note that the report primarily focuses on the six-county SCAG region, which includes Imperial, Los Angeles, Orange, Riverside, San Bernardino, and Ventura Counties.
What: Quantifying the Ridership Picture
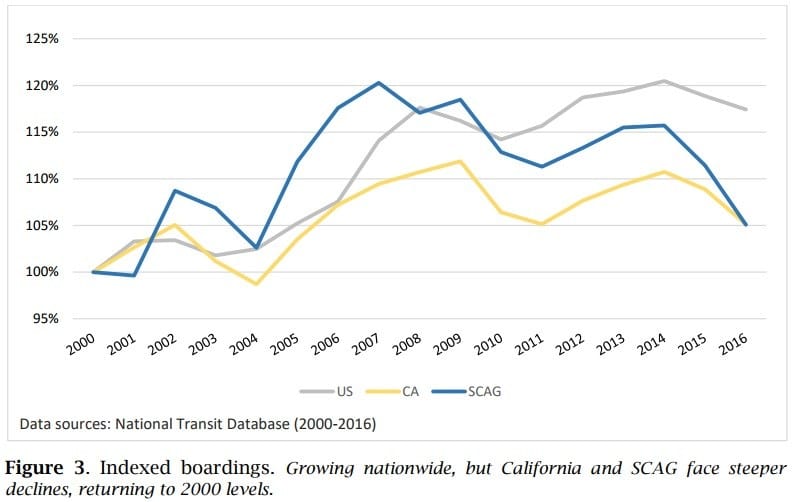
The report focuses primarily on 2000 through 2015-16. During this period, in per capita terms, Southern California transit ridership was relatively flat until 2007, then began to trend down. In absolute numbers, ridership began trending downward in 2012.


The report makes some comparisons between different California regions. Statewide, the Bay Area sees a higher transit mode share (6 percent) than SCAG (5 percent), though, with more of the state’s population, SCAG is home to more transit trips (52 percent of CA’s transit trips).

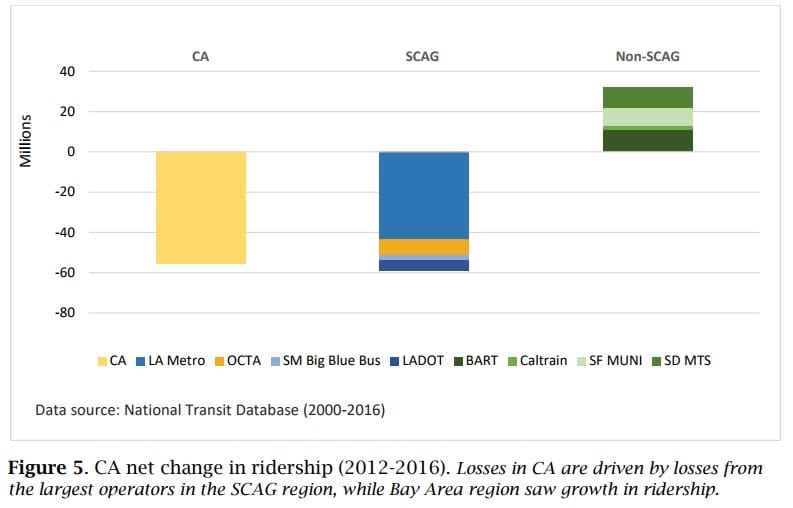
From 2000 to 2016, the Bay Area and San Diego area saw modest increases in transit ridership. California ridership was down due to declines in L.A. and Orange Counties.

The researchers found that the larger changes were concentrated among a small group of people and in a small number of places.
From 2012 to 2016 in California, annual transit boardings fell by 62.2 million. During that time, the SCAG region lost 72 million annual rides – 120 percent of the state total. In 2012, 82 percent of SCAG transit trips were in L.A. County. Further, Metro accounts for most of SCAG transit trips, and a dozen of Metro’s ~100 transit routes accounted for 53 percent of Metro’s 2012-2016 ridership losses.
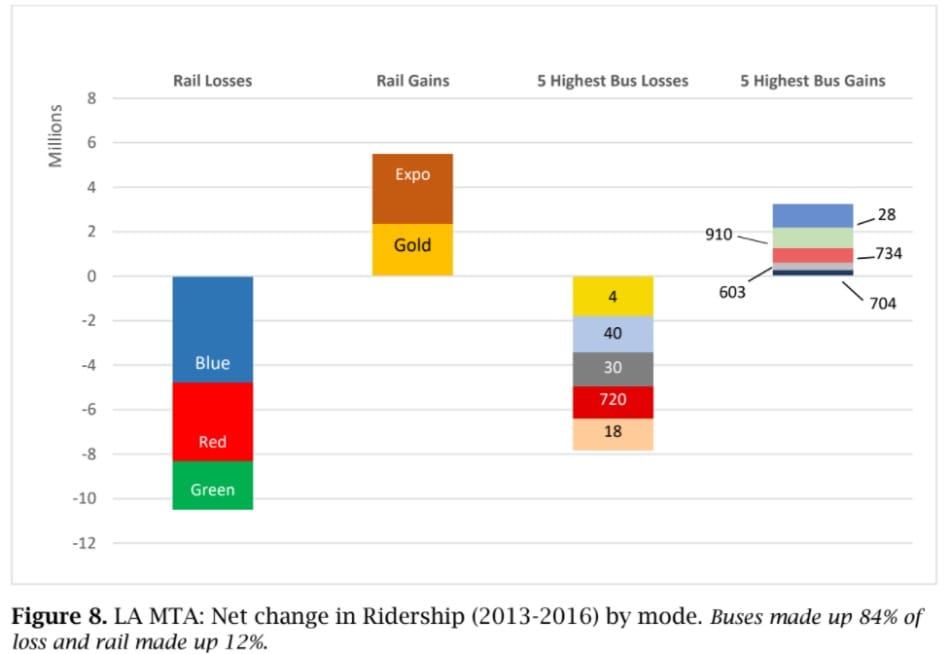
The study states that “Metro by itself accounted for a remarkable 72 percent of the state’s losses. Because L.A. Metro’s losses are themselves highly concentrated, a dozen routes from LA Metro account for 38 percent of all the lost ridership in California. Half of California’s total lost ridership is accounted for by 17 L.A. Metro routes (14 bus and 3 rail lines) and one OCTA route.”

Why: Factors Within Transit Operators’ Control
The report charts transit service in terms of both vehicle revenue miles (VRM) and vehicle revenue hours (VRH). From these the authors conclude that “transit service supply has been mostly climbing in the SCAG region… there is no …case that faltering transit service supply is driving down patronage.” Further:
[For Metro] transit service supply has tended to follow, rather than lead, changes in ridership — at least through 2014. Beginning in 2014, bus service rose slightly while boardings plunged. Rail service, not surprisingly, has increased more than 150 percent since 2000, and ridership has increased as well, though more slowly. Both service and patronage have tailed off since 2014, but largely in concert— there is no obvious sign of one leading the other.
[Metro] data offer little evidence that service cuts are driving away customers. Instead service expansion has been accompanied by less ridership, with the main result being lost productivity, particularly for rapidly expanding rail and van services.
The researchers also looked at service quality: speed, reliability, and experience.
Speedwise, SCAG regional buses have slowed over time, likely due to “many factors, including worsening congestion, shifts from faster suburban to slower urban service, shorter stop spacing, and longer stop dwell times to load and unload passengers.” Further “Region-wide bus vehicle speeds declined five percent between 2000 and 2010, and another eight percent between 2010 and 2016, for a total drop in speed of nearly 13 percent over 16 years.” This could be part of a deteriorating spiral, where the slower buses go, the more riders shift to cars (see below), worsening congestion, and causing buses to go even slower.
Reliability and rider experience may influence ridership, but the report’s analysis was less conclusive. While Metro reliability appeared to improve, researchers could not “determine if Metro’s schedule adherence improved because its buses met the existing schedule more often, or because schedules themselves were changed.” Rider experience can be somewhat subjective, influenced by perceptions of safety.
Fares play some role in ridership, though the report found little influence as, adjusted for inflation, SCAG region per-mile fares largely remained “remarkably flat.” OCTA fares rose somewhat. Big Blue Bus and Foothill Transit fares rose slightly. Inflation meant Long Beach Transit and Metro fares effectively fell slightly, despite Metro’s 2014 fare increase.
Why: Factors Outside Transit Operators’ Control
While a number of factors – gas prices, ride-hail, gentrification – likely play some smaller role in declining ridership, the report finds that vehicle ownership fairly clearly plays a large role in declining transit ridership.
The report plots gas prices against transit usage, and finds “falling fuel prices to be a real but probably minor driver in falling transit use.”
There has been speculation that the rise of ride-hail Transportation Network Companies (TNC, ie: Lyft and Uber) may be siphoning off transit ridership. The report asserts that, though evidence is somewhat sparse, TNCs do appear to be a major factor in declining transit ridership. Among the reasons cited are the timing: TNC ridership was minimal until 2012, while per capita transit ridership has declined since 2007.
The authors cite increasing vehicle ownership, especially among lower-income households as a primary cause of decreasing ridership:
Between 2000 and 2015, vehicle access in the SCAG region became much more common. Households in the SCAG region, and especially lower-income households, dramatically increased their levels of vehicle ownership. Census summary file data show that from 2000 to 2015, the SCAG region added 2.3 million people and 2.1 million household vehicles (or 0.95 vehicles per new resident). To put that growth in perspective, from 1990 to 2000 the region added 1.8 million people but only 456,000 household vehicles (0.25 vehicles per new resident). The growth of household vehicles in the last 15 years has been astonishing.
Across the entire SCAG region, the share of households without vehicles fell 30 percent between 2000 and 2015, while the share of households with a vehicle deficit fell 14 percent. Among foreign-born households, these percent declines were larger — 42 percent and 22 percent — and among the foreign born from Mexico they were larger still. Among the foreign born from Mexico, the share of households without vehicles fell by two-thirds between 2000 and 2015, and the share with a vehicle deficit fell 28 percent. Thus car ownership rose across-the-board, but rose fastest among subgroups with a high propensity to ride transit. And these changes largely occurred between 2000 and 2010, which aligns with the timing of the transit downturn that began in 2007.
This begs a further question of what is causing these higher levels of car ownership. The report cites a number of causes:
- Car loans became easier during this time: “automobile credit also surged in the run-up to the Great Recession. And unlike home lending, which tightened considerably after the crash, automobile lending has remained relatively loose. […] Subprime auto loans also remain prevalent, allowing consumers with poor credit histories or low incomes to finance vehicle purchases.
- The number and composition of immigrants has changed: immigration from Asia rose, while immigration from Central America and Mexico fell. The study states that “immigrants overall are now a slightly smaller share of the population, but also more likely to own vehicles, and to own them earlier after arrival.”
- Formerly high transit usage neighborhoods are gentrifying: From the report “Particularly between 2000 and 2010, in these [higher transit-usage] neighborhoods we see falling transit commuting, falling population, a falling share of immigrants, falling poverty, more vehicle ownership, and higher earnings for workers overall but not those workers who commute via transit. All of this evidence is consonant with these neighborhoods becoming more affluent, with that affluence being associated with less transit use, and with people left out of that affluence remaining on transit.”
Where Does Southern California Transit Go From Here?
The report’s focus is on explaining what has already happened. It does not feature a list of recommendations to fix the problem of declining ridership. It even warns transit agencies that wooing poor riders may not be the best approach:
The advantages of automobile access, which are particularly large for low-income people with limited mobility, suggest that transit agencies should not respond to falling ridership by trying to win back former riders who now travel by auto. A better approach may be to convince the vast majority of people who rarely or never use transit to begin riding occasionally instead of driving. This task is unquestionably more difficult than serving frequent-riding transit dependents, and it would likely require weakening or removing some of the state’s and region’s entrenched subsidies for motor vehicle use.
One key takeaway is that “transit is unlikely to grow substantially, to accomplish its environmental goals, if driving remains artificially inexpensive.” There is a myriad of “entrenched subsides” that shift driver costs to the general public. These include sales taxes and general funds covering road transportation budgets, and parking requirements that bundle parking costs into rent, property, and product costs paid by everyone.
As SBLA has reported, even when Metro is building multi-billion-dollar subways, Metro continues to invest similar multi-billion-dollar amounts in highway widening. This is true under both Measure R and M sales taxes. The current investment builds on top of decades of U.S. transportation spendingthat has, by more than an order of magnitude, heavily favored cars over transit.
The result, according to the study, is: “Much of the region’s built environment is designed to accommodate the presence of private vehicles and to punish their absence. Extensive street and freeway networks link free parking spaces at the origin and destination of most trips. Driving is relatively easy, while moving around by means other than driving is not.”
If public policies heavily subsidize driving, should it come as a surprise that people, including low-income folks and recent immigrants, are choosing to drive?
Metro cannot be expected to stem the broad national tide of pro-car investment, but what can the agency do that is more-or-less within its purview?
Some cities, including Houston and Seattle, have seen ridership gains after reorganizing their bus networks. After setting aside its 2016 bus service reorganization plan, Metro is just getting underway on another similar effort. Last November, the Metro board approved a $1.3 million contract for the Systemwide Bus Network Restructuring Plan. In a press interview, the UCLA ITS authors encouraged Metro that reorganizing bus service is “still worth it,” but offered a caveat that, given the study’s findings of the suburbanization of the SCAG region’s housing and jobs, that the “payoff may not be as high now.” Brian D. Taylor spoke of how, in the past, concentrating frequent bus service on core trunk lines (generally at the expense of outer, more suburban areas) was a proven strategy for increasing ridership. Taylor encouraged Metro to proceed with the effort but did not expect it to be a silver bullet.
Commenting on the study, the NRDC’s Carter Rubin was not shy about recommendations. Rubin asserts that “Metro’s plans to overhaul the bus network are important, but we can’t wait until December 2019 to take action to make the buses more attractive and useful.” Rubin encourages Metro to “be aggressive in their response to the vicious cycle of more traffic leading to slower transit, leading to more people driving instead of taking transit, causing more traffic.” This could include:
- all-door boarding – which is standard on all lines in many cities, but being implemented at a snail’s pace at Metro
- stop-thinning
- working with cities to prioritize bus speed via bus-only lanes, including perhaps enforcing current bus-only lanes
As Metro Boardmember Mike Bonin pointed out, the agency’s new bus advertising revenue can pay for increasing and improving bus service.
Even though some media point to “free-falling” ridership that is in a “slump,” Metro’s bus and rail still deliver more than 1.2 million passenger rides on a typical weekday. The UCLA ITS report quantifies a decline that appears to be spiraling. It is up to Metro leadership to take ridership, and especially the bus system, more seriously. The Metro board can use the new study to create urgency to speed improvements to ensure effective transit service that serves mobility, equity, health, and the future of the region.
