Road Safety: a huge problem.
There were 1.25 million road fatalities worldwide in 2013. Crashes are also the leading cause of death for teenager in this country. California leads the nation for pedestrian fatalities.

Locally, Santa Monica leads California for pedestrian fatalities and injuries per vehicle mile traveled since 2008. The share of injured pedestrians and cyclists continues to rise in this ongoing calamity. The so-called vulnerable road users literally take the brunt of it, pay the price, in blood and trauma.
The pain and cost is most evident when a crash takes place, but the perception of unsafe roads has an ongoing effect which is no less painful: It discourages residents from using our roads in a sustainable and healthy manner. That in turn makes it so difficult to look beyond the car culture which holds us firmly in its grip.
At the police department, traffic enforcement has been moved around over the past decade and a half, and its own words the department is prioritizing moving traffic.
The “Traffic Enforcement Division” (2002) was downgraded into the sub-unit of the “Traffic Services Division” in 2007. A few years later enforcement becomes a unit of the “Traffic Section” (under Special Enforcements) and today it is a unit of a section of the Strategic Services Division. In their own words, their mission is “To work collaboratively with community partners and the city’s Traffic Engineering and Planning to positively impact traffic circulation in the city.” What then is the position of road safety in the work and the culture of our police?
A recent piece in the Los Angeles Times looked at a performance audit to improve pedestrian safety in San Diego. Using that audit as an example, I want to propose a closer look at our own enforcement activities. The San Diego audit includes 18 recommendations, many directed at the police department, on how the city can improve the safety of their residents. Is there room for improvement in Santa Monica?
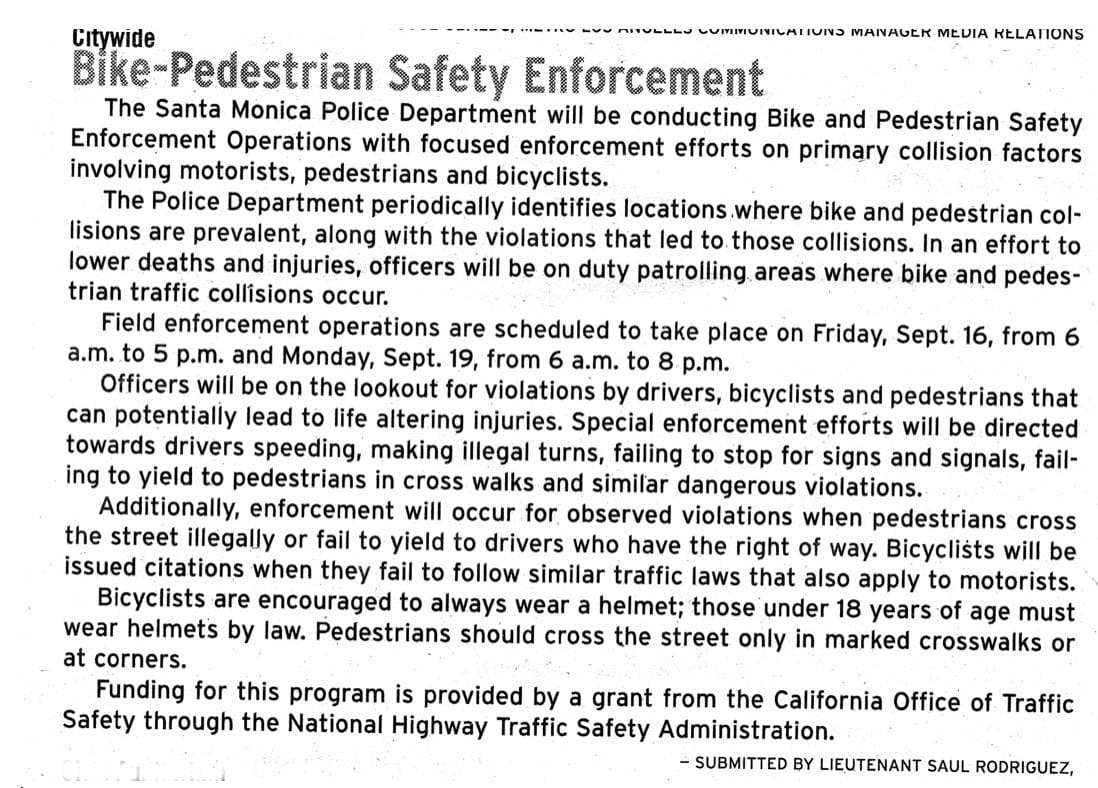
Santa Monica City Council has signed up to Vision Zero in February 2016 and promised “to consistently prioritize road user safety.” Indeed, scanning the local papers readers may have encountered the announcement, issued by SMPD, vaguely entitled “Bike Pedestrian Safety Enforcement.”

For those who believe in community policing, these announcements offer a curious view of police work in Santa Monica. The archives of the local paper and the SMPD website hold a total of 58 announcements, the first dating from November 2014.
The wording of each announcement remains largely identical. The title promises a Bike-Pedestrian focus, but the text is obscure. Reprint it 58 times, we still do not know if they are trying to issue tickets to pedestrians so that they are not hit by cars? The language of the announcement is wooden and awkward. It is the utterance of an institution which does not offer transparency. These are not words which communicate, this is language to build barriers. These words never crossed the path of a journalist with a passion for marketing road safety. While road safety has a lot to do with education, these words fail to educate or engage their audience. I count 58 missed opportunities.
What can we discover when we look at the complete series of these announcements? Could the dates and times noted there help us to understand the culture of policing in Santa Monica? 21 events are announced without a specific time. 13 events end at 8pm, another 13 are scheduled to end at 6 pm, and 7 events end at 4pm, 4 events end at 5pm or 7pm.
For those who walk in Santa Monica, the time of day is important. As the day comes to an end, all the cars head home as many residents are out to watch the sunset, walk their dogs, go for a run in the neighborhood or come home from the bus stop. During the hours of darkness it is often difficult to catch the attention of drivers. The early evening is prime time for conflicts and collisions, but the timing of the enforcement events does not seem to reflect this.
The enforcement series has now been running for almost 2 years. If we look at the seasonal distribution, we notice that enforcement during days with more than 12 hours of daylight (between 21 March to 21 September) far outweigh those during the winter months (42 to 16).
Shorter days bring early darkness, pedestrians become invisible for drivers, their eyes blinded by the screen of their phone, and crashes go up. The period between September 2015 and January 2016, when no events were announced, may account for this seasonal imbalance.
Both in terms of seasonal distribution, and in terms of time of day, special enforcement events should focus on those hours of the day when conflicts on out roads are most likely to occur. The data tells us that 70% of all pedestrian fatalities occur after 6 pm. Why place a motorcycle officer at an intersection at 11 am in the morning, when nobody is out walking?
When breaking down the enforcement activity by weekday we can now assert that Tuesdays is the best day to jaywalk or to make that illegal turn in Santa Monica. On average, each weekday would have had 8.28 events, but as a matter of record, Tuesday only had a single event (on 21 July 2015), whereas Friday and Saturday had 12 and 19 events.
What keeps our officers off the road on Tuesday? Is it because on the Saturday the number of cyclists increases in Santa Monica, since everybody is heading to the beach for their ride? Does that mean that the enforcement is focussed on violations committed by cyclists? And have the violations committed by cyclists been shown to lead to collisions?
But the main question must be: How effective is the program? After two years of special traffic safety enforcement, it is a good time to look at the data and evaluate the program. The announcement itself, mostly issued Sergeant Rudy Camarena, speaks about locations that are “periodically identified”. Which are these locations, how are they being identified, what is the impact of enforcement at those location?
Let us also look at the number and the kind of tickets that have been written during the period of special enforcement. How do these figures compare to days without special enforcement? How many more drivers, pedestrians and cyclists are being cited or warned on these enforcement days? More important still is an overview of the violations that are being enforced. The San Diego audit found that 20% of all pedestrian crashes involved failure to yield to pedestrian, but only 0.34% of all tickets were written for this violation. Beverly Hills has also seen a steep decline of citations for reds light runners. (Exhibit 13) We really need to know that SMPD gathers this data, studies and shares it, and adjusts its programs accordingly.
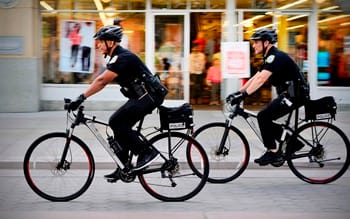
Back in 2003 and 2004, when Traffic Enforcement still had the status of a Division in the SMPD, pedestrian decoy and speed detection radar were part of the local toolbox. They have not been used since 2004. It is time to find a new balance between “positively impacting traffic circulation in the city” and the desire that we all arrive home safely tomorrow. A close look at the report for San Diego will be very helpful, but we should also ask: When will we have police officers on bicycles in traffic to end the plague of distraction created by handheld devices?
The perception of dangerous streets has serious consequences. Residents choose the car even for short trips because they feel walking or cycling is too dangerous. But offer our residents a professional newspaper announcement about special road safety efforts, one that can convince them that our police take road safety serious, and you will change minds.
Once residents see a police officer ride a bicycle patrol on Wilshire and on Lincoln, and once an officer on foot patrol crosses a residential road with them at 7pm in October, residents will be encouraged to make green and healthy choices for their own trips.
